Market
See the market behind the cars.
Track values, transactions, supply, and market movement across the collector cars and marques that matter.
Demo market data — production feeds not yet connected · as of 24 Sep 2026
STABLE Collector Market Index
1,086.4
STABLE Collector Market Index
The collector car market, in one line
A cohort index across the collector segments STABLE tracks, normalised to 1,000 in January 2024. Demo series.
Index, January 2024 = 1,000 · monthly
View as table
| Month | Index | Since Jan 2024 |
|---|---|---|
| Sep 2026 | 1,086.4 | +8.6% |
| Aug 2026 | 1,085.4 | +8.5% |
| Jul 2026 | 1,083.0 | +8.3% |
| Jun 2026 | 1,082.8 | +8.3% |
| May 2026 | 1,079.1 | +7.9% |
| Apr 2026 | 1,077.4 | +7.7% |
| Mar 2026 | 1,073.5 | +7.3% |
| Feb 2026 | 1,072.6 | +7.3% |
| Jan 2026 | 1,070.4 | +7.0% |
| Dec 2025 | 1,067.7 | +6.8% |
| Nov 2025 | 1,067.9 | +6.8% |
| Oct 2025 | 1,063.2 | +6.3% |
| Sep 2025 | 1,061.6 | +6.2% |
| Aug 2025 | 1,061.4 | +6.1% |
| Jul 2025 | 1,059.1 | +5.9% |
| Jun 2025 | 1,058.1 | +5.8% |
| May 2025 | 1,055.5 | +5.6% |
| Apr 2025 | 1,048.3 | +4.8% |
| Mar 2025 | 1,048.5 | +4.8% |
| Feb 2025 | 1,046.2 | +4.6% |
| Jan 2025 | 1,039.7 | +4.0% |
| Dec 2024 | 1,037.6 | +3.8% |
| Nov 2024 | 1,033.4 | +3.3% |
| Oct 2024 | 1,033.4 | +3.3% |
| Sep 2024 | 1,029.3 | +2.9% |
| Aug 2024 | 1,025.3 | +2.5% |
| Jul 2024 | 1,020.2 | +2.0% |
| Jun 2024 | 1,018.6 | +1.9% |
| May 2024 | 1,014.7 | +1.5% |
| Apr 2024 | 1,010.8 | +1.1% |
| Mar 2024 | 1,009.4 | +0.9% |
| Feb 2024 | 1,004.0 | +0.4% |
| Jan 2024 | 1,000.0 | 0.0% |
- Sep 20261,086.4
- Index
- 1,086.4
- Since Jan 2024
- +8.6%
- Aug 20261,085.4
- Index
- 1,085.4
- Since Jan 2024
- +8.5%
- Jul 20261,083.0
- Index
- 1,083.0
- Since Jan 2024
- +8.3%
- Jun 20261,082.8
- Index
- 1,082.8
- Since Jan 2024
- +8.3%
- May 20261,079.1
- Index
- 1,079.1
- Since Jan 2024
- +7.9%
- Apr 20261,077.4
- Index
- 1,077.4
- Since Jan 2024
- +7.7%
- Mar 20261,073.5
- Index
- 1,073.5
- Since Jan 2024
- +7.3%
- Feb 20261,072.6
- Index
- 1,072.6
- Since Jan 2024
- +7.3%
- Jan 20261,070.4
- Index
- 1,070.4
- Since Jan 2024
- +7.0%
- Dec 20251,067.7
- Index
- 1,067.7
- Since Jan 2024
- +6.8%
- Nov 20251,067.9
- Index
- 1,067.9
- Since Jan 2024
- +6.8%
- Oct 20251,063.2
- Index
- 1,063.2
- Since Jan 2024
- +6.3%
- Sep 20251,061.6
- Index
- 1,061.6
- Since Jan 2024
- +6.2%
- Aug 20251,061.4
- Index
- 1,061.4
- Since Jan 2024
- +6.1%
- Jul 20251,059.1
- Index
- 1,059.1
- Since Jan 2024
- +5.9%
- Jun 20251,058.1
- Index
- 1,058.1
- Since Jan 2024
- +5.8%
- May 20251,055.5
- Index
- 1,055.5
- Since Jan 2024
- +5.6%
- Apr 20251,048.3
- Index
- 1,048.3
- Since Jan 2024
- +4.8%
- Mar 20251,048.5
- Index
- 1,048.5
- Since Jan 2024
- +4.8%
- Feb 20251,046.2
- Index
- 1,046.2
- Since Jan 2024
- +4.6%
- Jan 20251,039.7
- Index
- 1,039.7
- Since Jan 2024
- +4.0%
- Dec 20241,037.6
- Index
- 1,037.6
- Since Jan 2024
- +3.8%
- Nov 20241,033.4
- Index
- 1,033.4
- Since Jan 2024
- +3.3%
- Oct 20241,033.4
- Index
- 1,033.4
- Since Jan 2024
- +3.3%
- Sep 20241,029.3
- Index
- 1,029.3
- Since Jan 2024
- +2.9%
- Aug 20241,025.3
- Index
- 1,025.3
- Since Jan 2024
- +2.5%
- Jul 20241,020.2
- Index
- 1,020.2
- Since Jan 2024
- +2.0%
- Jun 20241,018.6
- Index
- 1,018.6
- Since Jan 2024
- +1.9%
- May 20241,014.7
- Index
- 1,014.7
- Since Jan 2024
- +1.5%
- Apr 20241,010.8
- Index
- 1,010.8
- Since Jan 2024
- +1.1%
- Mar 20241,009.4
- Index
- 1,009.4
- Since Jan 2024
- +0.9%
- Feb 20241,004.0
- Index
- 1,004.0
- Since Jan 2024
- +0.4%
- Jan 20241,000.0
- Index
- 1,000.0
- Since Jan 2024
- 0.0%
Index family
From the whole market to one car
Each index narrows the cohort: marque, nameplate, generation, variant.
Segments
Which parts of the market are moving
12-month change by collector segment.
- Analog Supercars+8.9%
- Japanese Icons+7.2%
- European Sports+5.4%
- Classic 4x4+3.8%
- American Performance+2.9%
- Modern Collectibles−1.8%
Featured markets
Markets to watch
Average sale and supply from public market pages; index and movement are demo.
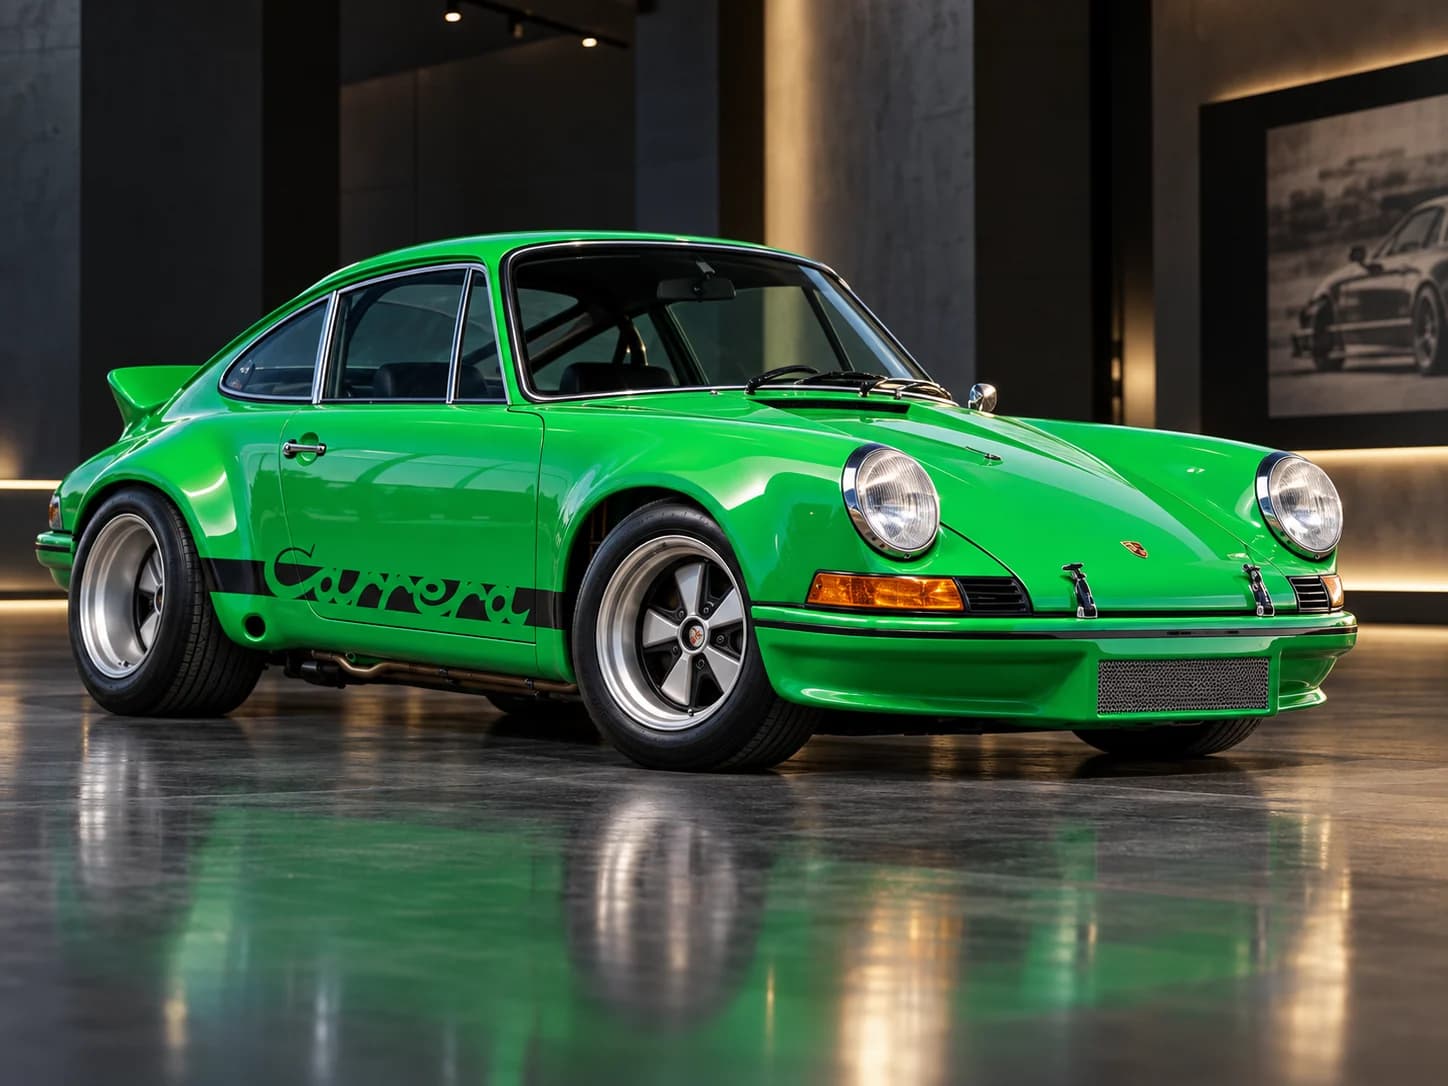
Marque
Porsche
1,142.8- Average sale
- $114,041
- For sale
- 5,164
CLASSIC.COMDemo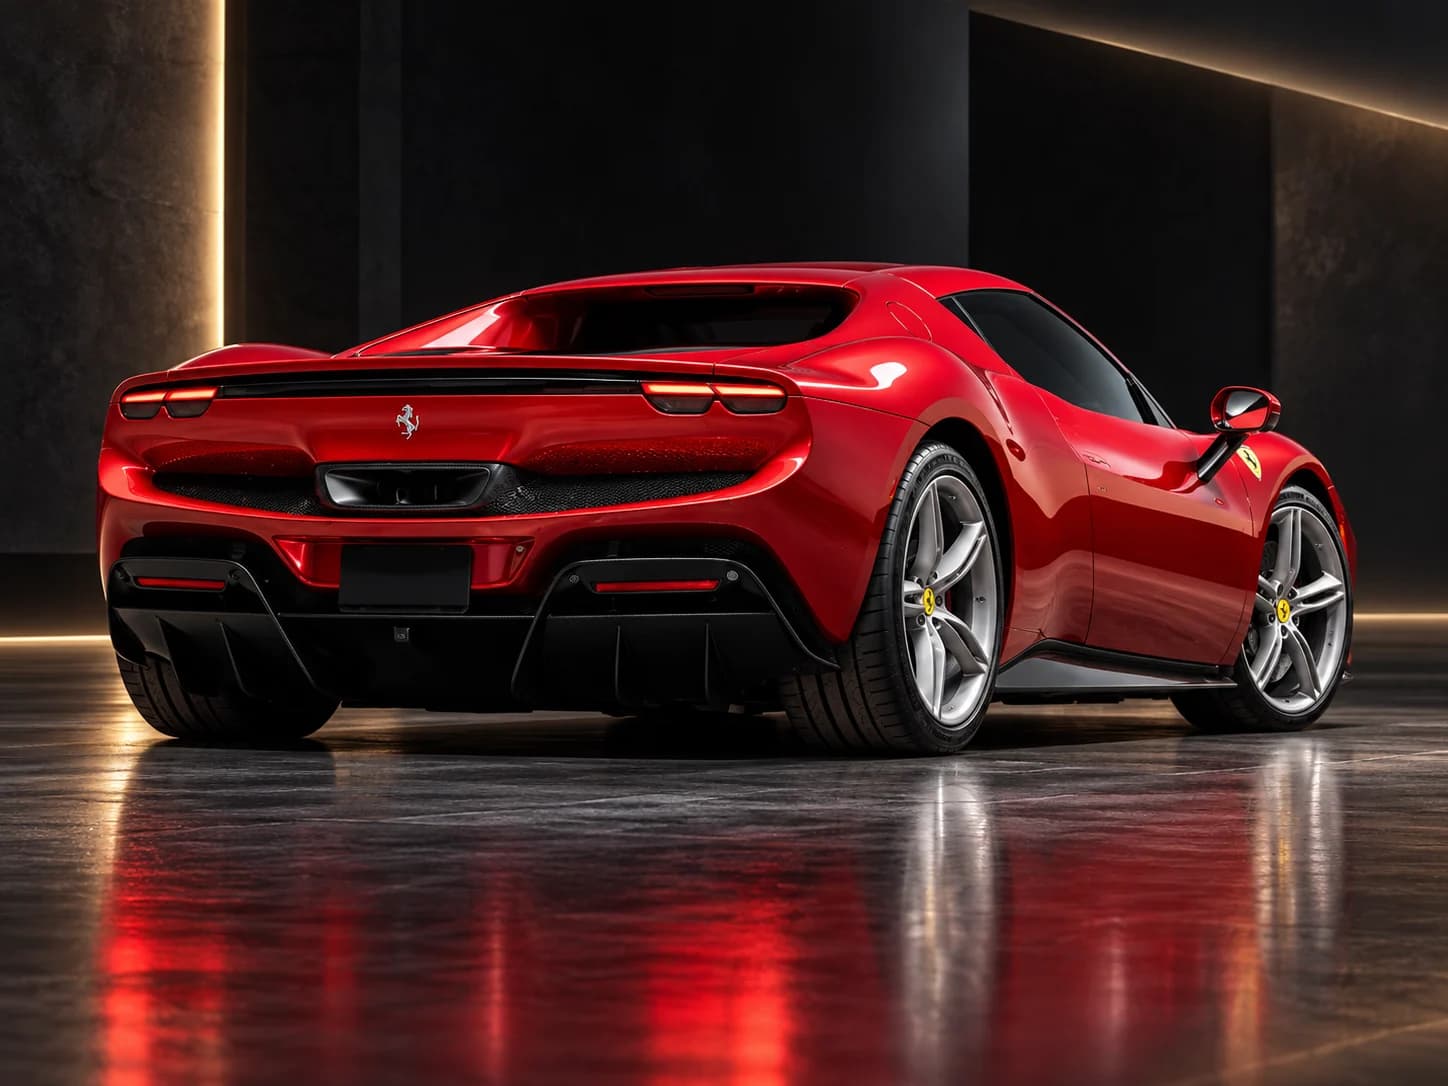
Nameplate
Porsche 911
1,184.6- Average sale
- $118,134
- For sale
- 2,659
CLASSIC.COMDemo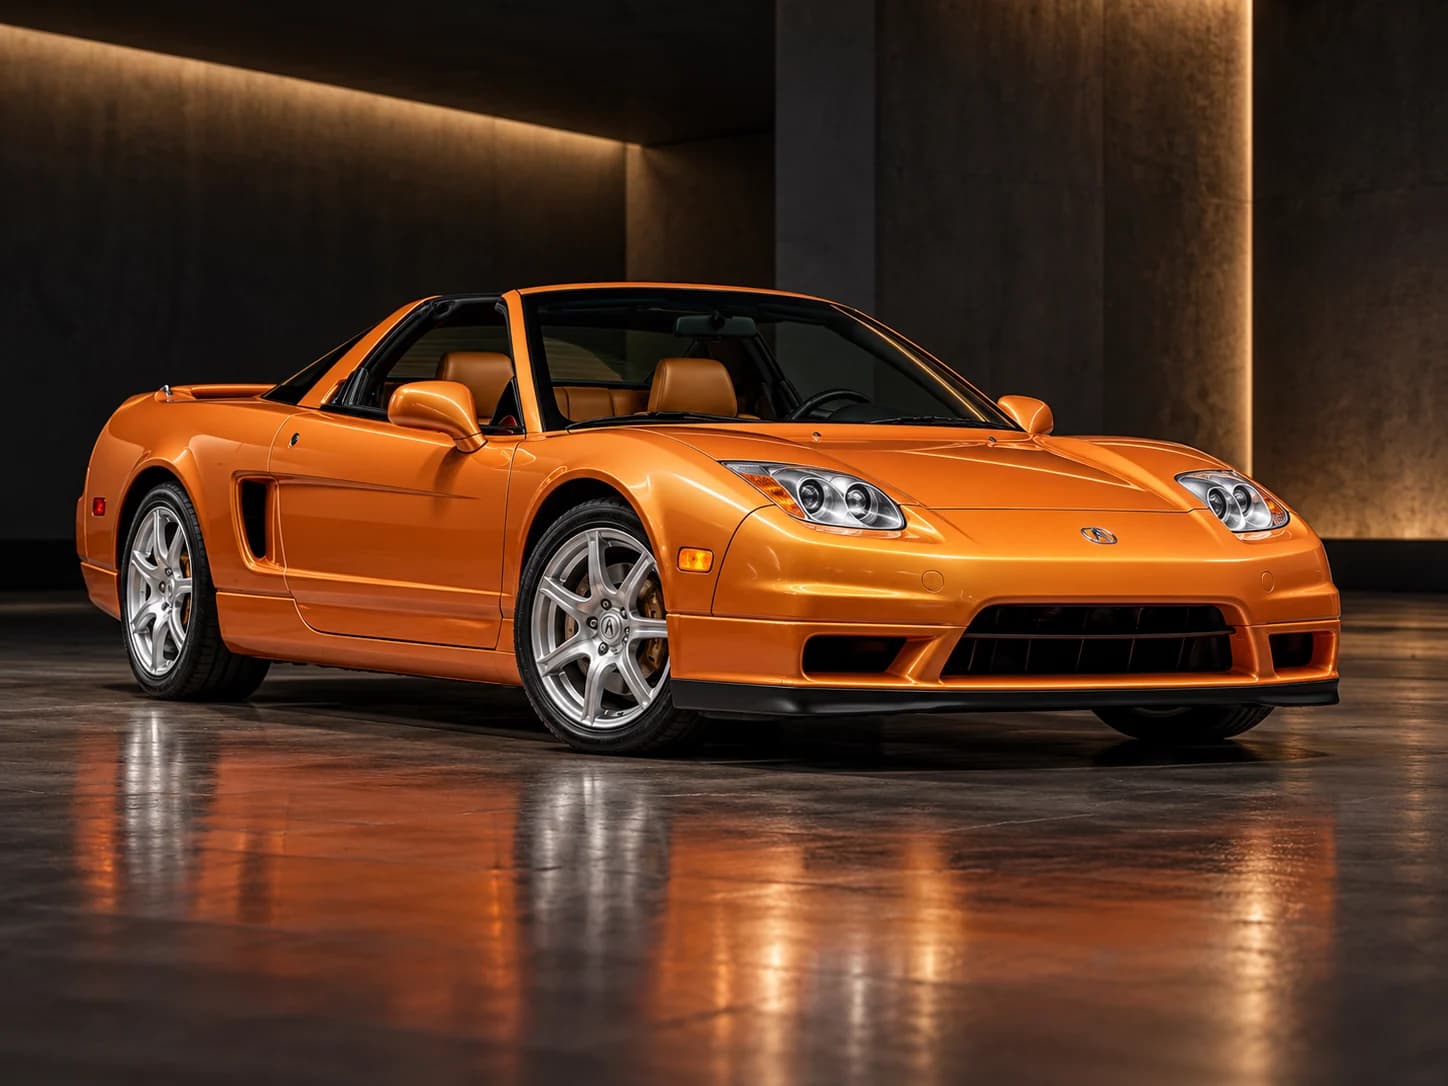

Nameplate
Ford Bronco
1,116.9- Average sale
- $67,149
- For sale
- 146
Variant
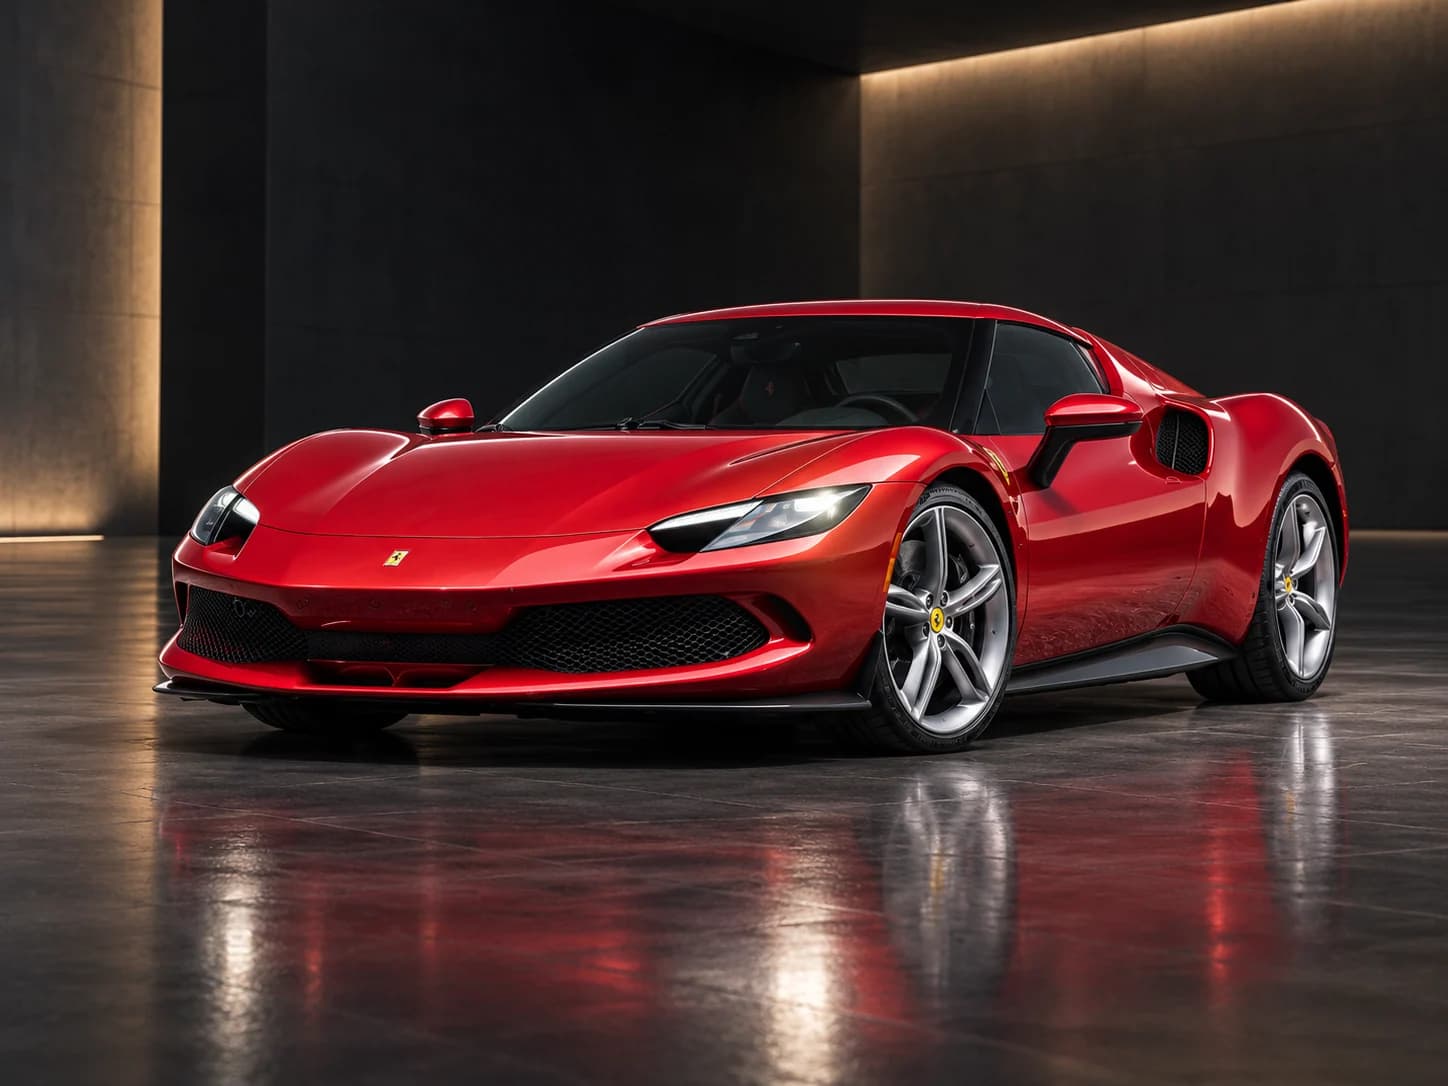
Ferrari 296 GTB
923.8- Average sale
- $313,277
- For sale
- 34
Recent sales
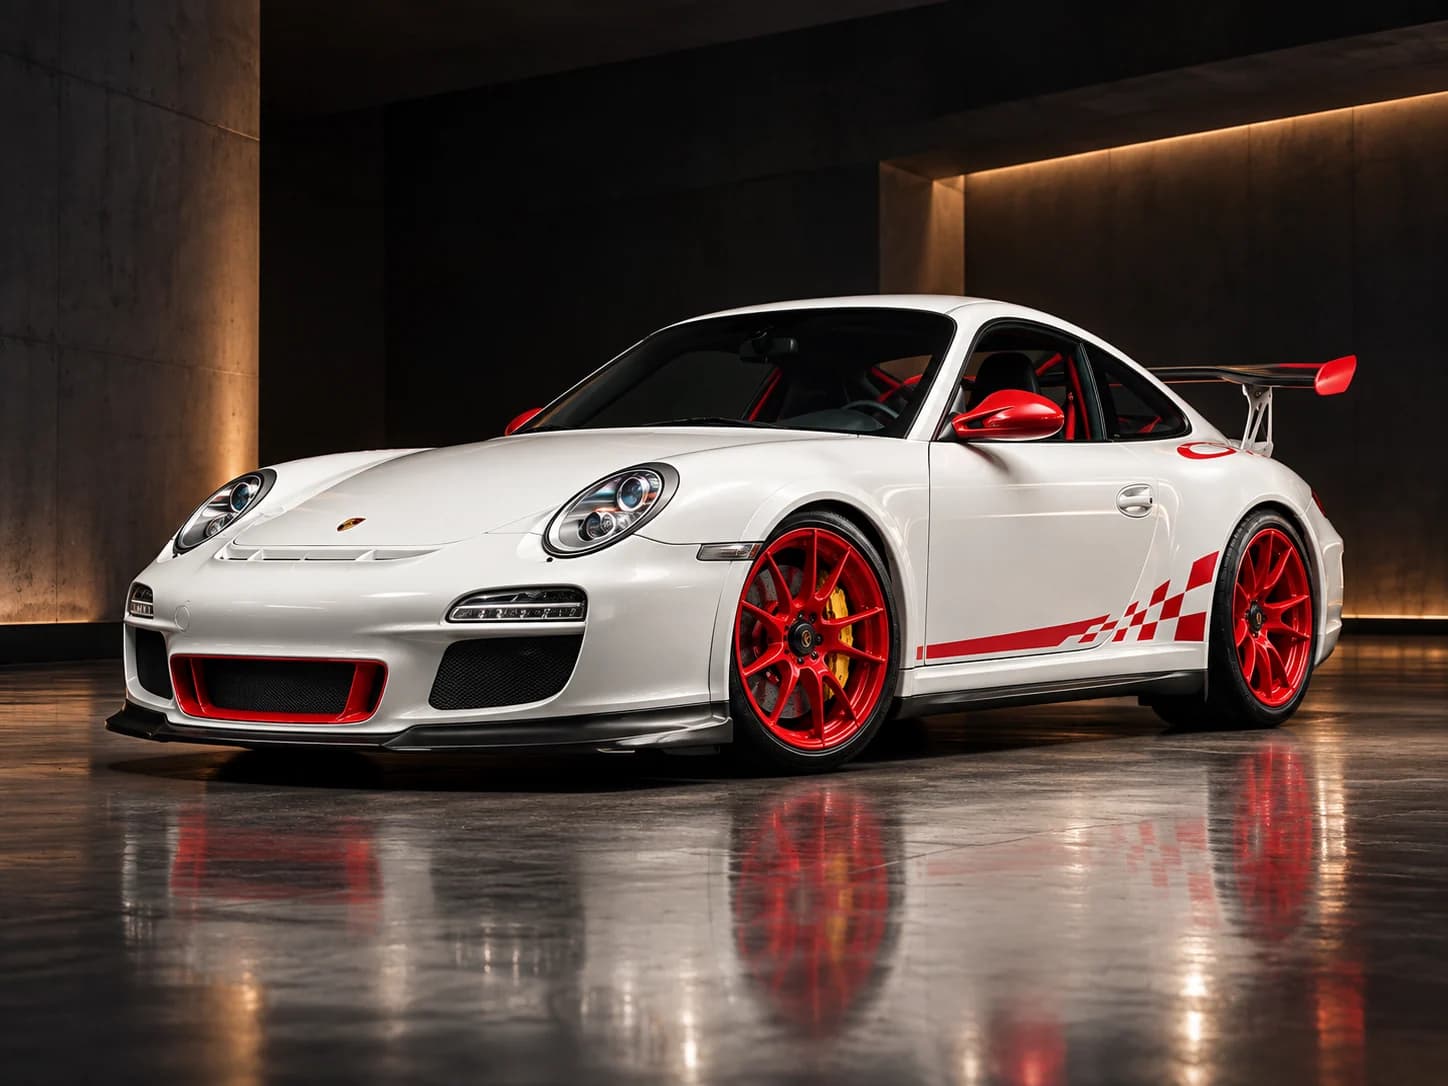
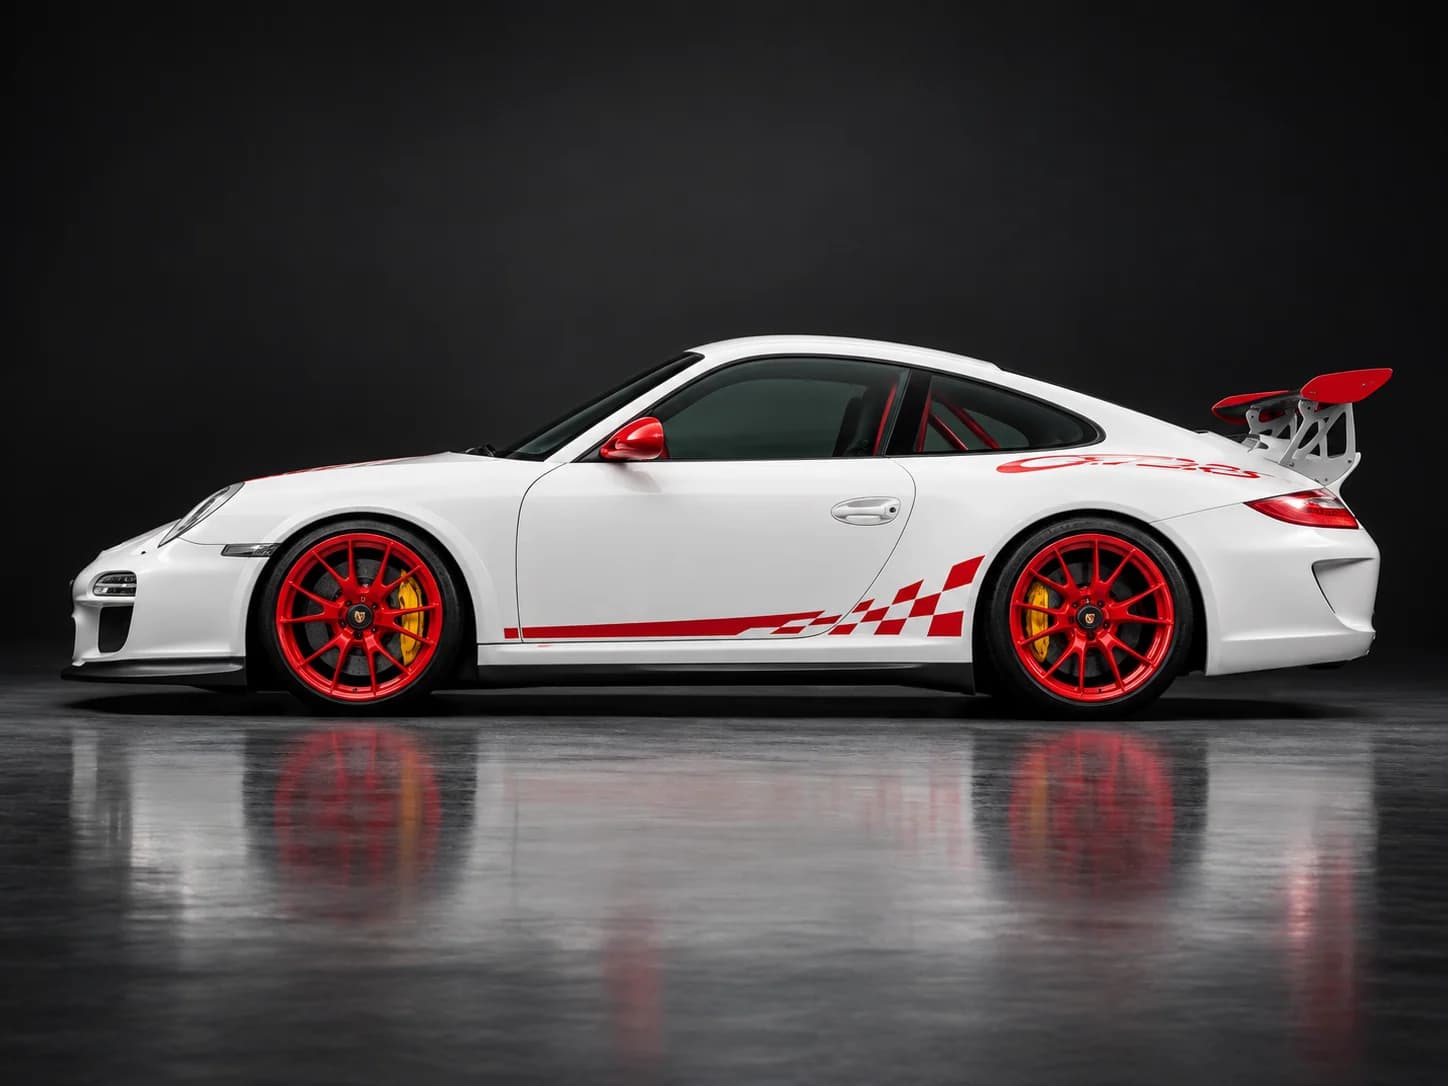
Porsche 911 GT3 RS (997.2)
2011 Porsche 911 GT3 RS
Grey Black / Red · 8,500 mi · Demo auction
$412,000Demo2010 Porsche 911 GT3 RS
Carrara White / Red · 10,000 mi · Bring a Trailer
2011 Porsche 911 GT3 RS
Highest recorded sale
2010 Porsche 911 GT3 RS
White / Red · 17,200 mi · Demo dealer sale
$365,000Demo2011 Porsche 911 GT3 RS
Black / Red · 24,500 mi · Demo auction
$338,000Demo
Supply
Cars for sale now
- Porsche5,164
- Porsche 9112,659
- Ferrari1,252
- Ford Bronco146
- Acura NSX38
- Ferrari 296 GTB34
Public source (CLASSIC.COM). Other counts are demo.
Index or Stable Value?
An index shows how a group of cars has moved: a marque, a generation, a variant. A Stable Value estimates what one specific car is worth today, with its range and confidence.
How STABLE measures the marketSources and data status
Figures tagged Demo are synthetic and exist only to show how this page will work. Figures tagged with a source were summarised from that public page on 24 Sep 2026. STABLE indexes are normalised to 1,000 in January 2024. An index tracks a group of cars; a Stable Value estimates one car.
- CLASSIC.COM · Porsche · 24 Sep 2026
- CLASSIC.COM · Ferrari · 24 Sep 2026
- CLASSIC.COM · Ferrari 296 GTB · 24 Sep 2026
- CLASSIC.COM · Acura NSX · 24 Sep 2026
- CLASSIC.COM · Ford Bronco · 24 Sep 2026
- CLASSIC.COM · 911 GT3 RS (997.2) · 24 Sep 2026
- Bring a Trailer · 2010 911 GT3 RS · 6 Jul 2026