Variant
Porsche 911 GT3 RS (997.2)
Values, recent transactions, active supply, and market context for the 997-generation GT3 RS.
Demo market data — production feeds not yet connected · as of 24 Sep 2026

STABLE 997.2 GT3 RS Index
1,368.5
Stable Value
$345,000
Offered now
19
Median asking
$389,000
Index
STABLE 997.2 GT3 RS Index
How the prices of this group of cars have moved, month by month. Demo series.
Index, January 2024 = 1,000 · monthly
View as table
| Month | Index | Since Jan 2024 |
|---|---|---|
| Sep 2026 | 1,368.5 | +36.9% |
| Aug 2026 | 1,359.6 | +36.0% |
| Jul 2026 | 1,354.6 | +35.5% |
| Jun 2026 | 1,350.1 | +35.0% |
| May 2026 | 1,337.8 | +33.8% |
| Apr 2026 | 1,327.2 | +32.7% |
| Mar 2026 | 1,321.3 | +32.1% |
| Feb 2026 | 1,306.9 | +30.7% |
| Jan 2026 | 1,302.3 | +30.2% |
| Dec 2025 | 1,293.7 | +29.4% |
| Nov 2025 | 1,281.7 | +28.2% |
| Oct 2025 | 1,275.5 | +27.6% |
| Sep 2025 | 1,270.5 | +27.0% |
| Aug 2025 | 1,251.8 | +25.2% |
| Jul 2025 | 1,248.1 | +24.8% |
| Jun 2025 | 1,238.1 | +23.8% |
| May 2025 | 1,226.5 | +22.6% |
| Apr 2025 | 1,207.3 | +20.7% |
| Mar 2025 | 1,195.6 | +19.6% |
| Feb 2025 | 1,183.4 | +18.3% |
| Jan 2025 | 1,175.8 | +17.6% |
| Dec 2024 | 1,158.2 | +15.8% |
| Nov 2024 | 1,143.6 | +14.4% |
| Oct 2024 | 1,139.0 | +13.9% |
| Sep 2024 | 1,123.3 | +12.3% |
| Aug 2024 | 1,106.9 | +10.7% |
| Jul 2024 | 1,094.8 | +9.5% |
| Jun 2024 | 1,069.7 | +7.0% |
| May 2024 | 1,066.4 | +6.6% |
| Apr 2024 | 1,041.5 | +4.2% |
| Mar 2024 | 1,033.3 | +3.3% |
| Feb 2024 | 1,009.4 | +0.9% |
| Jan 2024 | 1,000.0 | 0.0% |
- Sep 20261,368.5
- Index
- 1,368.5
- Since Jan 2024
- +36.9%
- Aug 20261,359.6
- Index
- 1,359.6
- Since Jan 2024
- +36.0%
- Jul 20261,354.6
- Index
- 1,354.6
- Since Jan 2024
- +35.5%
- Jun 20261,350.1
- Index
- 1,350.1
- Since Jan 2024
- +35.0%
- May 20261,337.8
- Index
- 1,337.8
- Since Jan 2024
- +33.8%
- Apr 20261,327.2
- Index
- 1,327.2
- Since Jan 2024
- +32.7%
- Mar 20261,321.3
- Index
- 1,321.3
- Since Jan 2024
- +32.1%
- Feb 20261,306.9
- Index
- 1,306.9
- Since Jan 2024
- +30.7%
- Jan 20261,302.3
- Index
- 1,302.3
- Since Jan 2024
- +30.2%
- Dec 20251,293.7
- Index
- 1,293.7
- Since Jan 2024
- +29.4%
- Nov 20251,281.7
- Index
- 1,281.7
- Since Jan 2024
- +28.2%
- Oct 20251,275.5
- Index
- 1,275.5
- Since Jan 2024
- +27.6%
- Sep 20251,270.5
- Index
- 1,270.5
- Since Jan 2024
- +27.0%
- Aug 20251,251.8
- Index
- 1,251.8
- Since Jan 2024
- +25.2%
- Jul 20251,248.1
- Index
- 1,248.1
- Since Jan 2024
- +24.8%
- Jun 20251,238.1
- Index
- 1,238.1
- Since Jan 2024
- +23.8%
- May 20251,226.5
- Index
- 1,226.5
- Since Jan 2024
- +22.6%
- Apr 20251,207.3
- Index
- 1,207.3
- Since Jan 2024
- +20.7%
- Mar 20251,195.6
- Index
- 1,195.6
- Since Jan 2024
- +19.6%
- Feb 20251,183.4
- Index
- 1,183.4
- Since Jan 2024
- +18.3%
- Jan 20251,175.8
- Index
- 1,175.8
- Since Jan 2024
- +17.6%
- Dec 20241,158.2
- Index
- 1,158.2
- Since Jan 2024
- +15.8%
- Nov 20241,143.6
- Index
- 1,143.6
- Since Jan 2024
- +14.4%
- Oct 20241,139.0
- Index
- 1,139.0
- Since Jan 2024
- +13.9%
- Sep 20241,123.3
- Index
- 1,123.3
- Since Jan 2024
- +12.3%
- Aug 20241,106.9
- Index
- 1,106.9
- Since Jan 2024
- +10.7%
- Jul 20241,094.8
- Index
- 1,094.8
- Since Jan 2024
- +9.5%
- Jun 20241,069.7
- Index
- 1,069.7
- Since Jan 2024
- +7.0%
- May 20241,066.4
- Index
- 1,066.4
- Since Jan 2024
- +6.6%
- Apr 20241,041.5
- Index
- 1,041.5
- Since Jan 2024
- +4.2%
- Mar 20241,033.3
- Index
- 1,033.3
- Since Jan 2024
- +3.3%
- Feb 20241,009.4
- Index
- 1,009.4
- Since Jan 2024
- +0.9%
- Jan 20241,000.0
- Index
- 1,000.0
- Since Jan 2024
- 0.0%
Value
Stable Value, and the evidence around it
An estimate for a typical example, with its range and confidence, next to the public benchmarks it can be checked against.
Stable Value
Demo$345,000
- Range
- $310,000 – $390,000
- Confidence
- High
Public benchmarks
- Market benchmark
- $344,131CLASSIC.COM (source, opens in a new tab)
- Average sale
- $299,937CLASSIC.COM (source, opens in a new tab)
- Highest recorded sale
- $625,000CLASSIC.COM (source, opens in a new tab)
- Hagerty, 2010, good condition
- $238,333 – $311,667Hagerty (source, opens in a new tab)
Benchmarks describe the whole market; a Stable Value describes one car. Mileage, condition and specification move a car away from the benchmark.
Transactions
Recent sales
Newest first. Mileage plotted against price where it was recorded.
2011 Porsche 911 GT3 RS
Grey Black / Red · 8,500 mi · Demo auction
$412,000Demo2010 Porsche 911 GT3 RS
Carrara White / Red · 10,000 mi · Bring a Trailer
2011 Porsche 911 GT3 RS
Highest recorded sale
2010 Porsche 911 GT3 RS
White / Red · 17,200 mi · Demo dealer sale
$365,000Demo2011 Porsche 911 GT3 RS
Black / Red · 24,500 mi · Demo auction
$338,000Demo
Mileage and price
Asking market
What’s offered now
Offered now
19
Median asking
$389,000
Median days listed
39 days
Sold within 90 days
68%
Asking prices, lowest to highest, median marked
Lowest $329,000 · median $389,000 · highest $625,000
Specification
What moves the price
How the median sale differs for cars with each attribute. Observed differences, not proven premiums: attributes travel together.
- Under 10k miles+18%
- PCCB+4%
- Carbon bucket seats+5%
- Rare factory color+9%
The car
2010 Porsche 911 GT3 RS
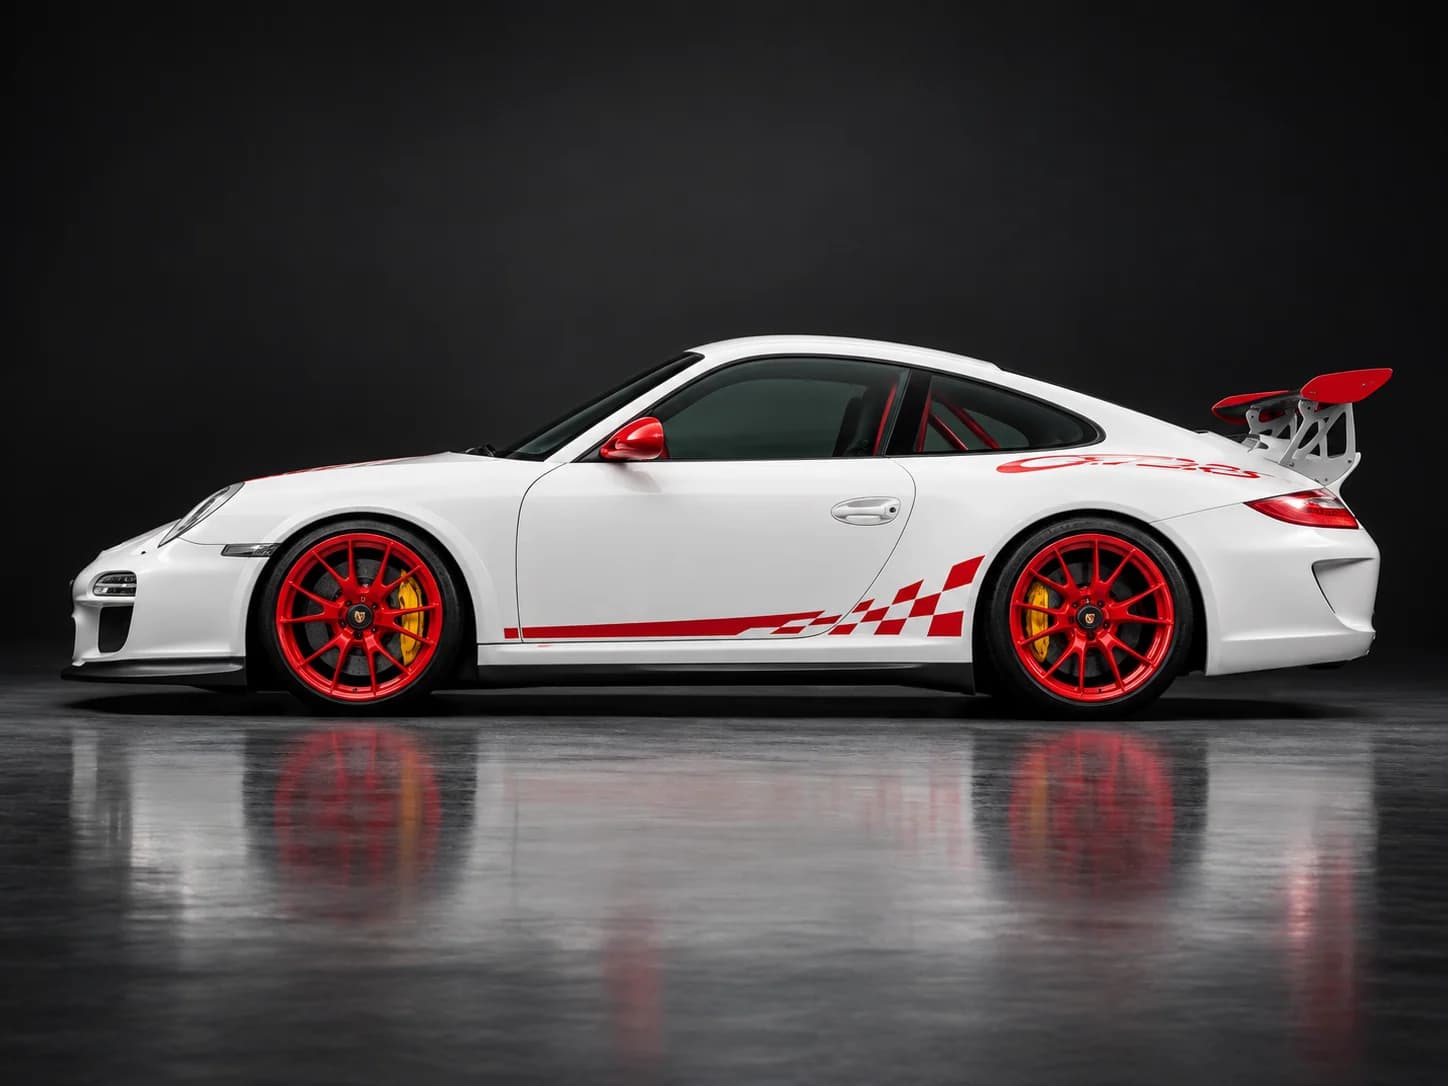
- Engine
- 3.8-litre Mezger flat-six
- Gearbox
- Six-speed manual
- Generation
- 997.2
- Example shown
- Carrara White with Guards Red accents
Sources and data status
Figures tagged Demo are synthetic and exist only to show how this page will work. Figures tagged with a source were summarised from that public page on 24 Sep 2026. STABLE indexes are normalised to 1,000 in January 2024. An index tracks a group of cars; a Stable Value estimates one car.
- CLASSIC.COM · 911 GT3 RS (997.2) · 24 Sep 2026
- Hagerty · 2010 911 GT3 RS · 24 Sep 2026
- Bring a Trailer · 2010 911 GT3 RS · 6 Jul 2026